
All features
Relationships
See the dynamic between two designs.
Composite Charts
Bring two client charts together to explore connection themes, friction, and complementary patterns for relationship, partnership, and team conversations.
The change in the work
Less friction before the client sees the result.
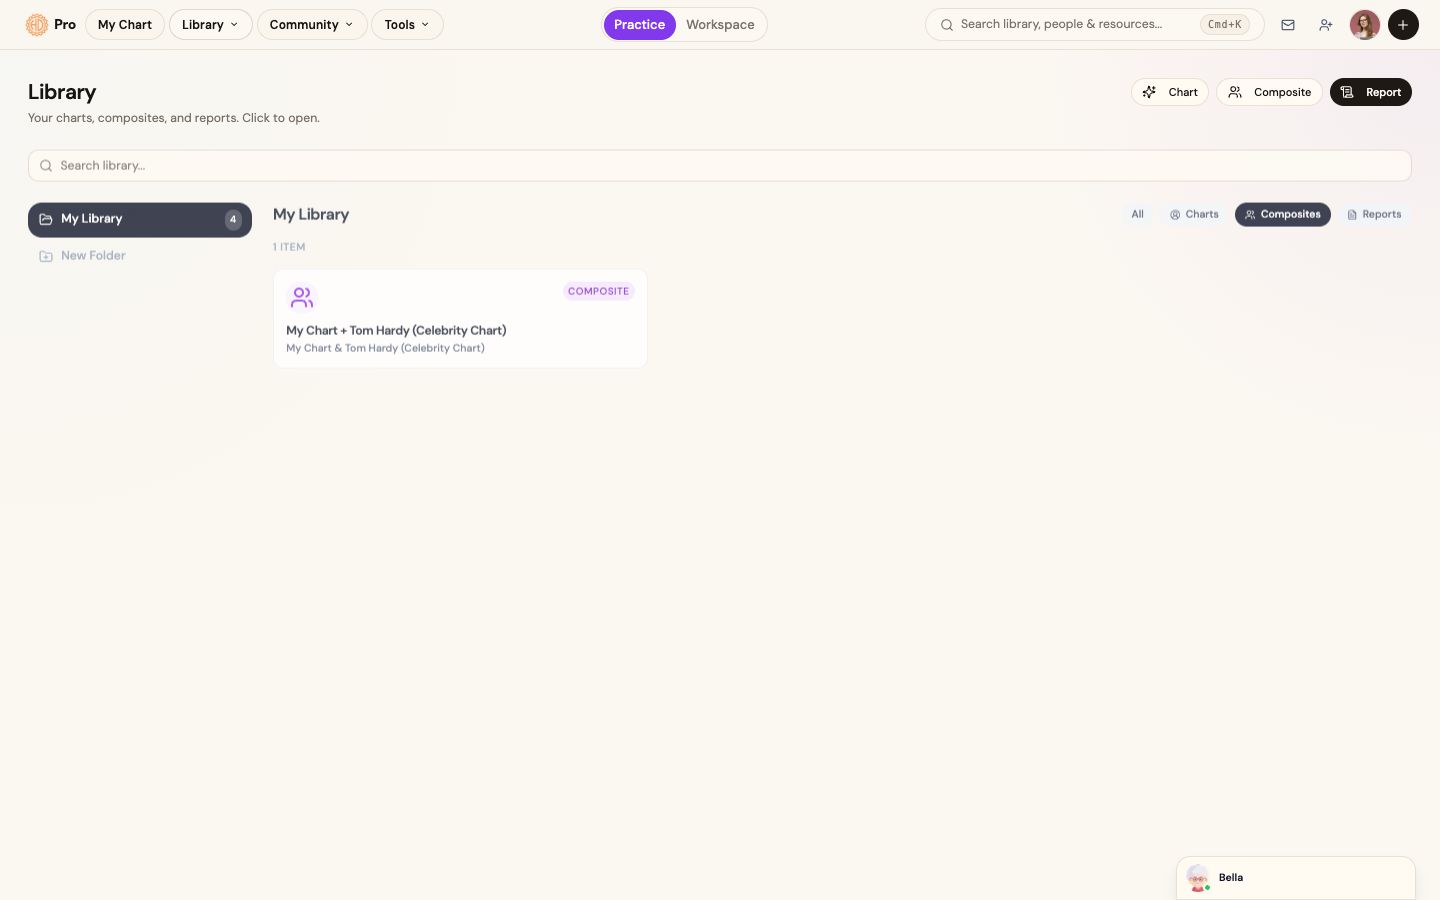
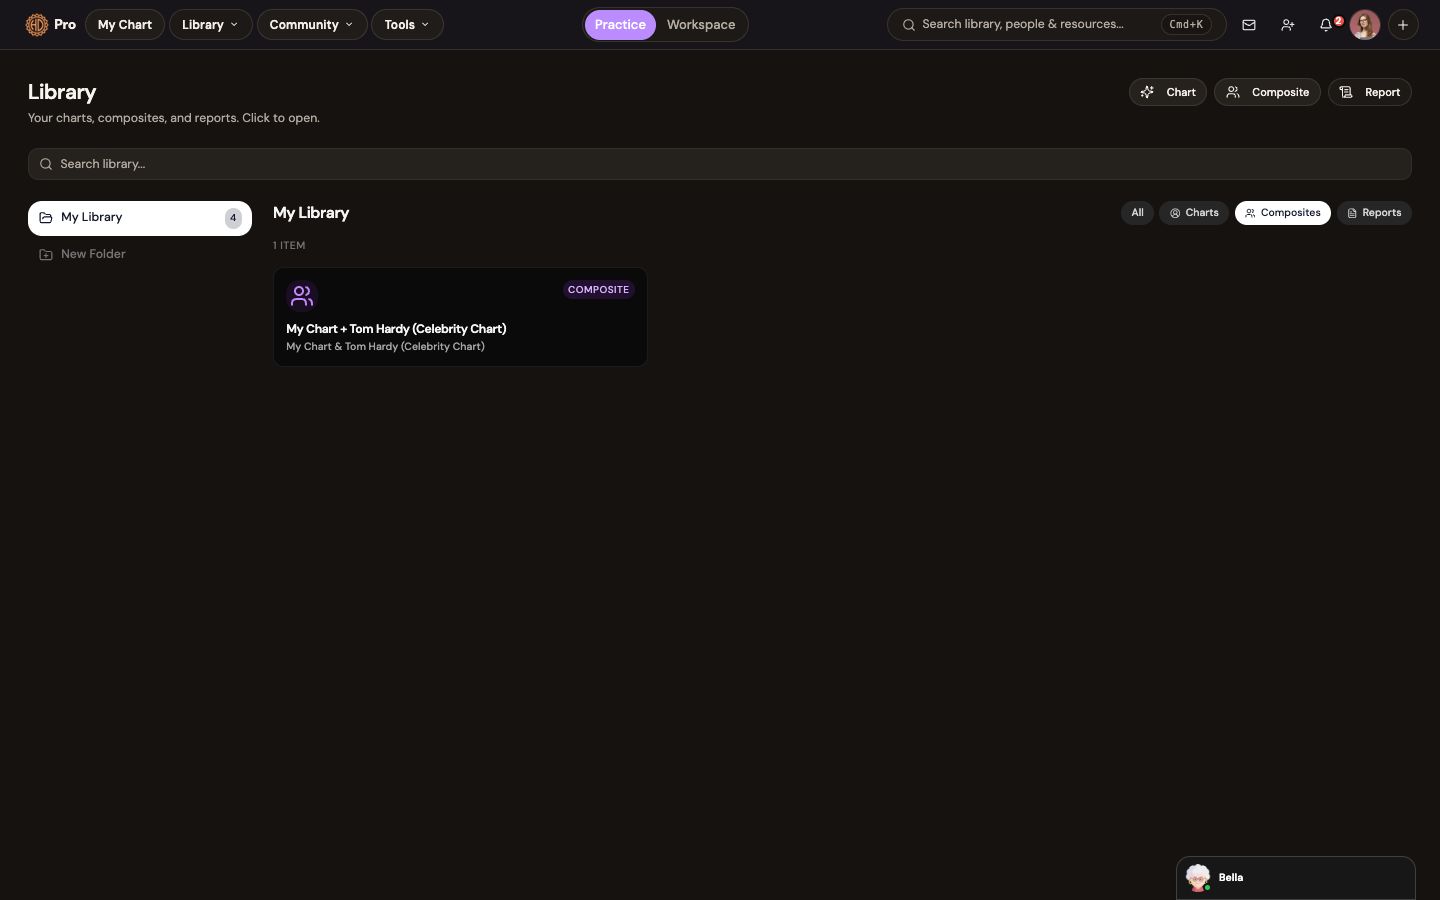
Select two saved charts and open their relationship context together.
Composite creation begins with two saved charts and produces a shared relationship view.
The workflow
How composite charts fits the work.
Select two charts
Choose two people from your client chart library.
Explore the dynamic
Review connection themes and ask focused questions.
Create the follow-up
Turn useful context into notes, a conversation, or a relationship report.
What this helps you accomplish
Keep the expertise yours. Reduce the busywork.
- Create a composite from two saved charts
- Explore connection mechanics in context
- Use the composite in reports and follow-up work
Existing platform review
“The platform is a game changer for anyone… running a Human Design business. Numerous report types. Built in AI. Sooo many tools.”
Jennifer F · January 20, 2026
Read the source reviewCommon questions
Know what the feature does and does not do.
Is a composite a relationship diagnosis?+
No. It is a reflective Human Design framework, not a clinical, legal, or predictive assessment.
Continue exploring